 , yes AND no] Looks super-effortless on his chart. For some reason, it stands out to me.

Will definitely refer back to this when I really try getting into zlines.
dragon33 M15 zlines
Moderator: moderators

 , yes AND no] Looks super-effortless on his chart. For some reason, it stands out to me.

TygerKrane wrote:So apparently, I'm so worried about my breakeven order getting 'wicked' before going onto bigger profits, that I am just letting my full stop get hit?!?
What IS my profit taking philosophy exactly??
I guess no one ever went broke taking a profit?? I'm making this way more difficult than it needs to be...
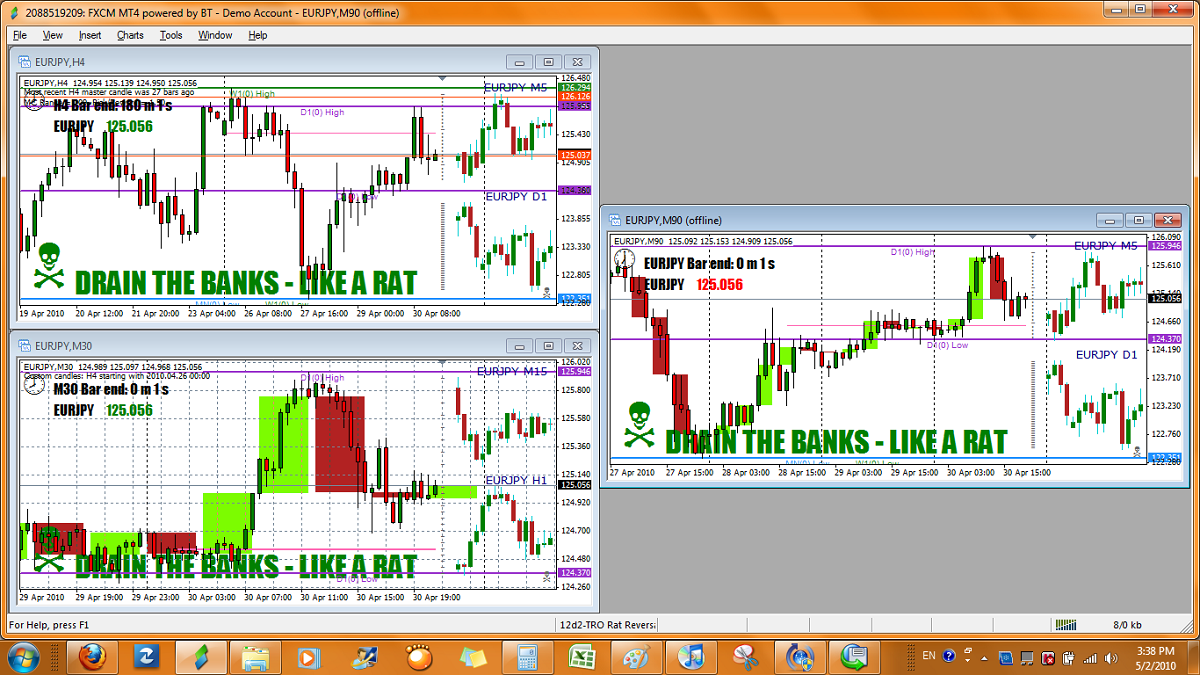


TygerKrane wrote:Nothing much to say I don't think, but I am happy with my progress. Spent the week working on using the Level Sensor as a Buy Zone. While doing this, tried observing the charts more for understanding zlines.
Added another bit to my MT4 setup, made a custom Time Frame chart of M90 and used Custom Candle to group them by three, so the chart is M90/4hr30min candles. I think I like having this as an intermediate Level Sensor.
I'm still slow on analysis, so I've been trading the EJ mainly, but working to handle both EJ and GU at the same time. I'll take my time, I do realize there is plenty of action already on just the EJ for my trading style and time frame. But options are always a good thing if it ends my trading day quicker.

MightyOne wrote:TygerKrane wrote:Nothing much to say I don't think, but I am happy with my progress. Spent the week working on using the Level Sensor as a Buy Zone. While doing this, tried observing the charts more for understanding zlines.
Added another bit to my MT4 setup, made a custom Time Frame chart of M90 and used Custom Candle to group them by three, so the chart is M90/4hr30min candles. I think I like having this as an intermediate Level Sensor.
I'm still slow on analysis, so I've been trading the EJ mainly, but working to handle both EJ and GU at the same time. I'll take my time, I do realize there is plenty of action already on just the EJ for my trading style and time frame. But options are always a good thing if it ends my trading day quicker.
My advise is to never combine more than 4 candles on any chart even if the combined candles cover the same data as a higher TF charts combined data.
You want to study each time frame independently and look at one time frame in relation to another (or why view multiple time frames?).

