newark18 wrote:PTG wrote:newark18 wrote:Like I said, sometimes MO's combined candles works perfectly (the lowest low and the highest high being the last STF in the CC). But sometimes it gets out of whack. So I've been playing around with it. In this example, the yellow area shows that the new combination puts these CCs out of whack while the green area are the candles that i am trying to optimize.
Can you find your way around, when the only thing you are looking at is your feet ?
Why do you think I am so lost?
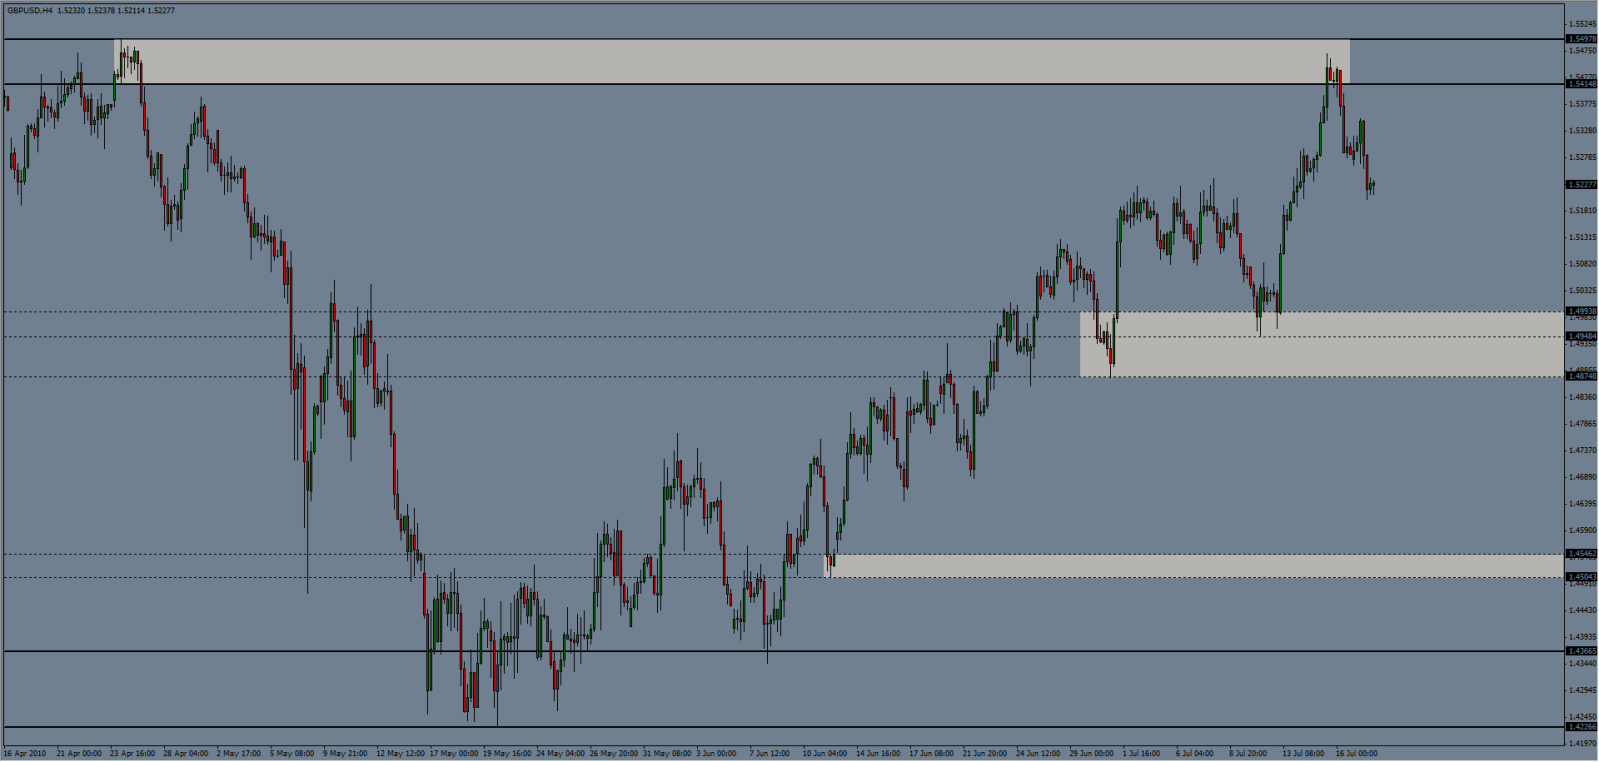
Long range candles are proof of the existence of support and resistance. Why did price fall down like a brick on the left ? A big imbalance between sellers and buyers perhaps ? Might they still be there the next time around, more often than not ? And what if, imagine, what if that next time around price comes screeming towards that level, and you have this feeling you're missing out on something reeeally good, you're kicking yourself in the head, swearing at the wife, etc. That's the feeling others have, who will typically enter way, way too late to not miss out on that good run. And gosh, what do you know - there are people waiting for that to happen. These are the people on the other side of the trade. That should be you. That's why you have to find those probable areas of instability, and then apply some common sense like multiple timeframe- and multiple candle analysis etc. You can either catch the falling knife or the rocket
But: enough of this now, this is not my thread and I certainly don't want to ask for some divine thunder and lightning