cwn6161 wrote:I am trying to gain more experience trading the daily, using CC of the H4 (H12) and H1 (H3). I find myself rarely looking at the daily charts, and using the H12 and H3 to find S&R.
What should I be looking for on the daily? I see S&R lines that are basically the same in all 3 time frames.
Is a large CC in the H3 an indication to take profit? Or H12? Or maybe seeing a large candle in all 3 time frames?
Clearly, I haven't gotten used to multiple time frames yet

Such are the problems you face when you can do whatever you want

Should I trade off of daily, weekly, monthly, or yearly highs or lows?
Bodies show the way...
-if the daily CC closes above a line then trade off of daily+ lows
-if the weekly CC closes below a line then trade off of weekly+ highs
-by the time you get to the monthly chart you are already trading in the right direction so your only focus is placing more lines if you haven't maxed out already.
-those who have a position of 10:1 from a yearly extreme own an account reset button; it is probable that you will double your account by the end of the year if you just leave the position alone.
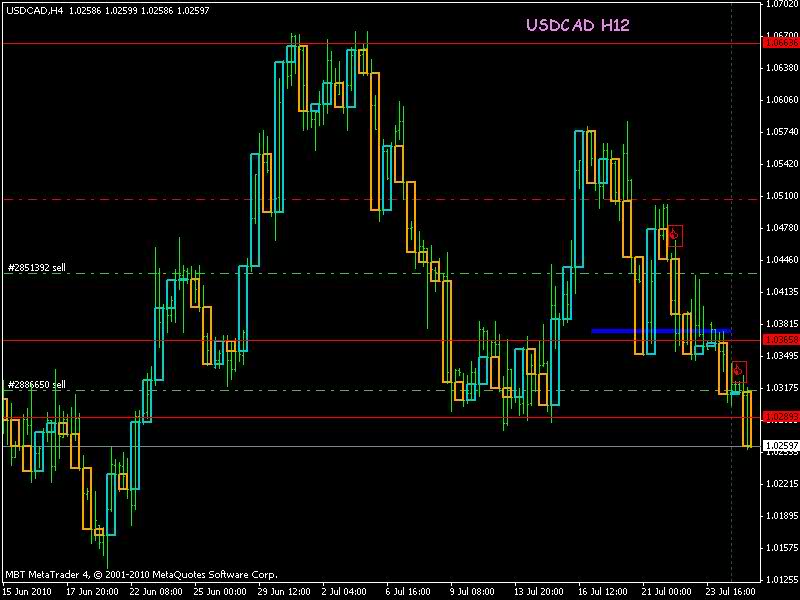
You decided that you are going to trade off of the daily low extreme? Not so fast buddy!
If you were short from the highs then where would you have exited?
Would you still be waiting for a long bodied candle?
Would you find a reason to devalue this close over a line based on a higher time frame?
Doing everything to hold your short position, if you would find a reason to hold then you simply cannot go long
Every thing looks good so far and you are ready to go long right?
Not so fast buddy!
What kind of distance can you expect from this trade?
What will your position look like if it closes here or here or here?
Is it probable that price will close over a line on the weekly chart?
How much distance could you possibly get out of this trade?
Will you have position on a monthly or yearly chart?
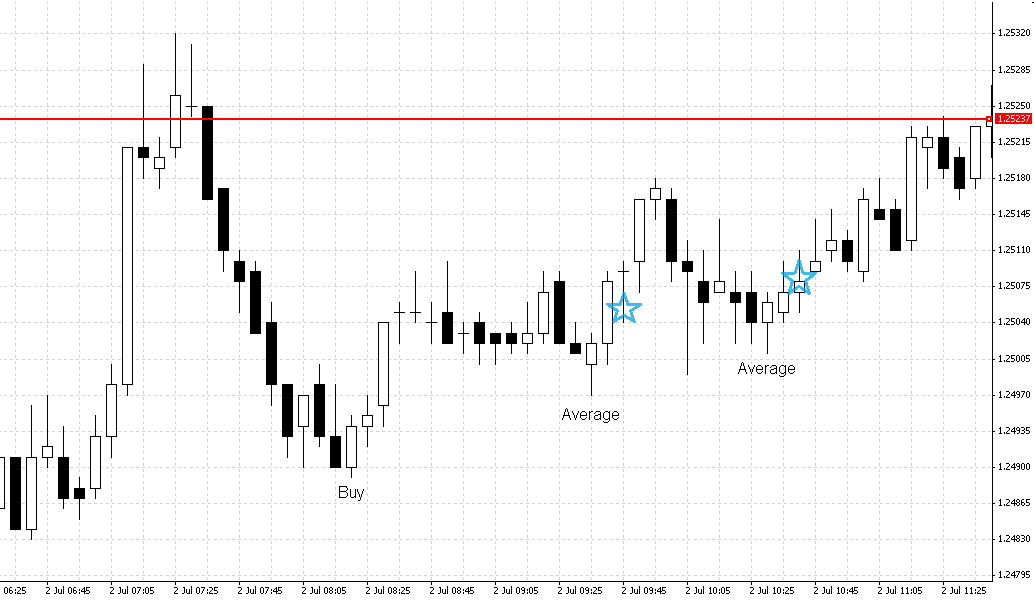
...ok so you think that you are ready to go long so let us look at the hourly chart?
What does the recent PA look like?
If you attempted to trade off of the previous extremes did price send Wick Dolls your way? Do you need to be more cautious or is the PA trendy?
Should you enter with 5:1 and a 90 pip pincushion or 10:1 with a 45 pip pincushion as your first trade? Where is the first line that price must close over to say that you are wrong and how large are the bodies of the recently closed candles?
You are done asking questions, you know where you are and where you are going, but before you go long there is one last thing you must do:
-Delete any line that represents resistance
You have already decided that price is going to close higher & higher & possibly much higher.
-Focus on support lines and placing average entries at or under them.
Accumulate questions as you reach greater and greater distances so that you can better plan such a run the next time around.


 ...<sigh>
  No talking till I come back wiser,

