Asking for a leg up - If suitable I can maybe help you with

If you don't know where to start, start here! Don't be afraid to ask questions.

Moderator: moderators

Relativity
rank: 150+ posts
rank: 150+ posts
Posts: 364
Joined: Mon Nov 15, 2010 4:19 pm
Reputation: 0
Gender: None specified

Postby Relativity » Thu Dec 15, 2011 9:06 am

kiwiautotrader wrote:Hi Relativity,

I think i will have to throw away all assumptions as well - I have done such an incredible amount of backtesting (hundreds of strats, scenarios and statistical analysis) and I cant find and edge as such anywhere.

It is helpful to meet people such as yourself.

I have tryed the DTB methods / ideas before and found nothing of any real value after very conclusive testing. Thats obbiously not to say that others havnt.

On a side note, I previously left this forum out of frustration. I have never come to a forum asking for all the answer the obscure/obtuse and repetitive answers from TRO finally drove me round the bend. I believed he was here to help and guide, but I so often saw very sensible questions being asked of him and very obtuse answers being given. I began to feel like we were all pawns in his own little game.


Trust me, I felt the same initially. When I came back, I realised what TRO wants is us as new traders to take personal ownership and humble ourselves down. This is critical. It cannot be taught, but only caught.

I will admit to you that backtesting doesn't do anything : you have to forward test. This means trying the method out yourself.

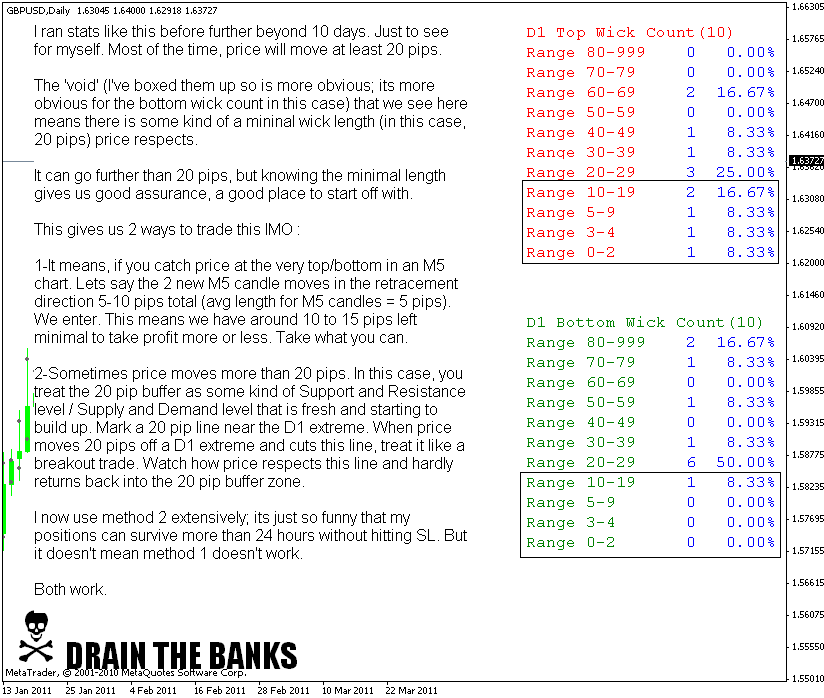
Now, you said you done some forward testing for DTB. I will speak here with some qualification : it does work. In fact, its the only obvious known way to trade. Its too obvious. Buy low. Sell high. The 1st problem is, which high? Which low? TRO says D1. Its actually more than enough; its the best answer; winning traders tend to be 'found' in D1 charts or higher. At the pschyological level at least. Doesn't mean one cannot be successful at lower timeframes than D1; just that its way easier to use D1 for most good traders.

Do you have google talk or skype? I can explain it to you in better detail there. There are so many reasons why 20 pips at a D1 candle high/low just, works. Very common sense, very very simple.

kiwiautotrader wrote:Dont get me wrong, I sooo appreciate people sharing their knowledge with others - but i also feel that the good nature of others has also been taken advantage of. It must be good for the ego.

Anyway I digress - to answer some of the questions

In a nutshell my favourite method (asian breakout) worked along the lines of x range of consolidation through the asian range on a typically clean trending pair. When the breakout occurs with momentum -


I can't be bothered about others taking advantage of goodwill. These people, in the long run, lose out the most anyway. So yeah =>

Can I admit to you something? You might not like it, but when you mentioned the phase 'my favourite method', my hands got cold. As traders, we can't play favourites like that. If it doesn't work, it doesn't work. Nothing about favouritism, nor hate too. Thats what I meant by 'you are 1/2 successful'. Its quite hard for anyone to admit their 'favourite' method is not working. But please do try to let go.

Anyway, thats the emotional analysis I have for you. Now, technically, here are my questions :

1-x range of consolidation = how big? how small? time based? pip based? is it a channel? slanted? straight across? squeezing? how do you define it? do you draw 2 trendlines to determine the range of consolidation?
2-does it really have to be asian range? what is your rational?
3-momentum : what is defined as momentum here? breakout candle? volume based breakout? how much is considered momentum?
4-what if the pair is not trending cleanly? maybe look at other pairs? have you considered that the markets are interconnected, so if one pair is not trending cleanly, the chances of other pairs not doing so too are also there?

Sorry for breaking all this down, but I would like to see you to be able to see where your problems are. These problems, both emotional and technical, small or big, are hindering your progress as a trader. If no one tells you what your problems are, you will never know, unless you really think deep and reflect hard enough on your own.

I just hope I am not overly too critical on you. But please bear with me if you are willing.

kiwiautotrader wrote:I would try and trail it using a "playbook" of exit options.

Regarding your question on have I been missing out on opportunities ...Undoubtably! But I have studied/implemented and tried an ehaustive range of techniques,theories,ideas along the way.

Thanks for your help...not really sure where to go next.


Don't worry =>

Please add www.kreslik.com to your ad blocker white list.
Thank you for your support.

Humble
rank: 500+ posts
rank: 500+ posts
Posts: 576
Joined: Fri Mar 20, 2009 10:29 am
Reputation: 4
Gender: Male

Postby Humble » Fri Dec 16, 2011 12:29 am

" There are so many reasons why 20 pips at a D1 candle high/low just, works. Very common sense, very very simple."

Explain on kreslik, I'm sure TRO would appreciate the confirmation.
Is price closing higher or lower than something? Simple yet powerful question. ..MO

Relativity
rank: 150+ posts
rank: 150+ posts
Posts: 364
Joined: Mon Nov 15, 2010 4:19 pm
Reputation: 0
Gender: None specified

Postby Relativity » Fri Dec 16, 2011 1:34 am

Humble wrote:" There are so many reasons why 20 pips at a D1 candle high/low just, works. Very common sense, very very simple."

Explain on kreslik, I'm sure TRO would appreciate the confirmation.


1 - This one came from TRO directly and I edited an explanation on the .png :
FREQUENCY DISTRIBUTION OF THE DAILY WICK SIZES FOR LAST 10 DAYS
Image

2- The average wick size of D1 is at least 30 pips for many pairs. This actually falls into the 20 pips range. Which means we can expect on the average at least, a retracement between 20 to 30 pips.

Avg Range, Avg Wick, Avg Body Stats

3- Price tends to like to breakout off boxes of 20 pips. This is proven when you look at the wave statistics of multiple small micro timeframes. Again, look at the 'void' areas of the higher timeframes I am talking about. These voids get 'filled up' with price action of lower timeframes.

Bell Curve Statistics

4- How is it that the average range of a H1 candle is also around 20 to 30 pips? And we all learn 'Always follow the H1 candle color'? A trend of a lower timeframe is a retracement of a higher timeframe. This translates to : a H1 candle range lives in a D1 candle wick

5- When you look at 1 + 2 + 3 + 4, you will eventually see how all the pieces actually do come together to give you a very very good description of price action. And its freaking tradable.

kiwiautotrader
rank: <50 posts
rank: <50 posts
Posts: 44
Joined: Fri Dec 03, 2010 7:07 pm
Reputation: 0
Gender: None specified

Postby kiwiautotrader » Fri Dec 16, 2011 6:20 am

Hi Relativity...

If you run that same analysis over a more representitive quantity...ie 365 the distribution is vastly different...

kiwiautotrader
rank: <50 posts
rank: <50 posts
Posts: 44
Joined: Fri Dec 03, 2010 7:07 pm
Reputation: 0
Gender: None specified

Postby kiwiautotrader » Fri Dec 16, 2011 6:28 am

"Do you have google talk or skype? I can explain it to you in better detail there. There are so many reasons why 20 pips at a D1 candle high/low just, works. Very common sense, very very simple."

That would be fantastic, I would really appreciate that - i iwll PM you and it would be great if we could t something up.

As for the answers to the questions -

Asian range, les than fifty, nice consolidation pattern. Yes must be the asian given that this period is normally quiet and the london session typically provides the trending moves of the day. Momnetum = lots of short price movements, frantic buying selling round breakout point followed by short punchy move. If chopping around to much then check out another pair. Simple as that!

Please add www.kreslik.com to your ad blocker white list.
Thank you for your support.

kiwiautotrader
rank: <50 posts
rank: <50 posts
Posts: 44
Joined: Fri Dec 03, 2010 7:07 pm
Reputation: 0
Gender: None specified

Postby kiwiautotrader » Fri Dec 16, 2011 6:32 am

Humble wrote:" There are so many reasons why 20 pips at a D1 candle high/low just, works. Very common sense, very very simple."

Explain on kreslik, I'm sure TRO would appreciate the confirmation.


Hi Relativity,

I must be missing something because I dont really understand how those stats in anyway statistically support taking a reversal trade at the LOD or HOD. Maybe that will come with talking to you personally !

Can I ask how many pips you will typically tuck away trading this style on a daily basis?

Relativity
rank: 150+ posts
rank: 150+ posts
Posts: 364
Joined: Mon Nov 15, 2010 4:19 pm
Reputation: 0
Gender: None specified

Postby Relativity » Fri Dec 16, 2011 8:44 am

kiwiautotrader wrote:Hi Relativity...

If you run that same analysis over a more representitive quantity...ie 365 the distribution is vastly different...


Good challenge. I've checked that out. I still see '20 pips' screaming at me. Do you see it? Here's my bell curve attached. You also reminded me that there is 1 more reason.... its also an interesting one.

kiwiautotrader wrote:"Do you have google talk or skype? I can explain it to you in better detail there. There are so many reasons why 20 pips at a D1 candle high/low just, works. Very common sense, very very simple."

That would be fantastic, I would really appreciate that - i iwll PM you and it would be great if we could t something up.

As for the answers to the questions -

Asian range, les than fifty, nice consolidation pattern. Yes must be the asian given that this period is normally quiet and the london session typically provides the trending moves of the day. Momnetum = lots of short price movements, frantic buying selling round breakout point followed by short punchy move. If chopping around to much then check out another pair. Simple as that!


I see what you mean. I see many major flaws in this method. Do you mind if I break it down against you?

kiwiautotrader wrote:
Humble wrote:" There are so many reasons why 20 pips at a D1 candle high/low just, works. Very common sense, very very simple."

Explain on kreslik, I'm sure TRO would appreciate the confirmation.


Hi Relativity,

I must be missing something because I dont really understand how those stats in anyway statistically support taking a reversal trade at the LOD or HOD. Maybe that will come with talking to you personally !

Can I ask how many pips you will typically tuck away trading this style on a daily basis?


20 pips or more. I then offset this 20++ pips to give me a good cushion for a long term / 2-5 day trade that runs.

Currently I have an open position for EURJPY that has been alive for more than 24 hours. The entry is 20 pips off the low. Can you imagine how many pips I would had taken if I just drew a line in the sand and trade off it's break on the upside?

The survivability and longevity of a well taken position from a price extreme, WILL ensure some kind of profit eventually.

Here's the proof.
Attachments
365 days wicks dist.PNG
365 days wicks dist.PNG (17.56 KiB) Viewed 4983 times
SL not hit.PNG
SL not hit.PNG (77.46 KiB) Viewed 4983 times

Relativity
rank: 150+ posts
rank: 150+ posts
Posts: 364
Joined: Mon Nov 15, 2010 4:19 pm
Reputation: 0
Gender: None specified

Postby Relativity » Fri Dec 16, 2011 9:17 am

More interesting findings since I have the time today. Do you see it?
Attachments
More Findings.PNG
More Findings.PNG (30.84 KiB) Viewed 4980 times

User avatar
newark18
rank: 500+ posts
rank: 500+ posts
Posts: 562
Joined: Thu Mar 11, 2010 3:32 am
Reputation: 21
Real name: J
Gender: None specified

Postby newark18 » Fri Dec 16, 2011 2:23 pm

Relativity,

For the life of me, I cannot understand how to read your stats and bell curve. Would you be so kind to explain the rows and columns and what the graphics represent?
Failure is an opportunity to learn.

Relativity
rank: 150+ posts
rank: 150+ posts
Posts: 364
Joined: Mon Nov 15, 2010 4:19 pm
Reputation: 0
Gender: None specified

Postby Relativity » Fri Dec 16, 2011 2:43 pm

newark18 wrote:Relativity,

For the life of me, I cannot understand how to read your stats and bell curve. Would you be so kind to explain the rows and columns and what the graphics represent?


Here you go.
Attachments
More Findings Legend.PNG
More Findings Legend.PNG (28.44 KiB) Viewed 4960 times

Please add www.kreslik.com to your ad blocker white list.
Thank you for your support.


Return to “beginners forum”