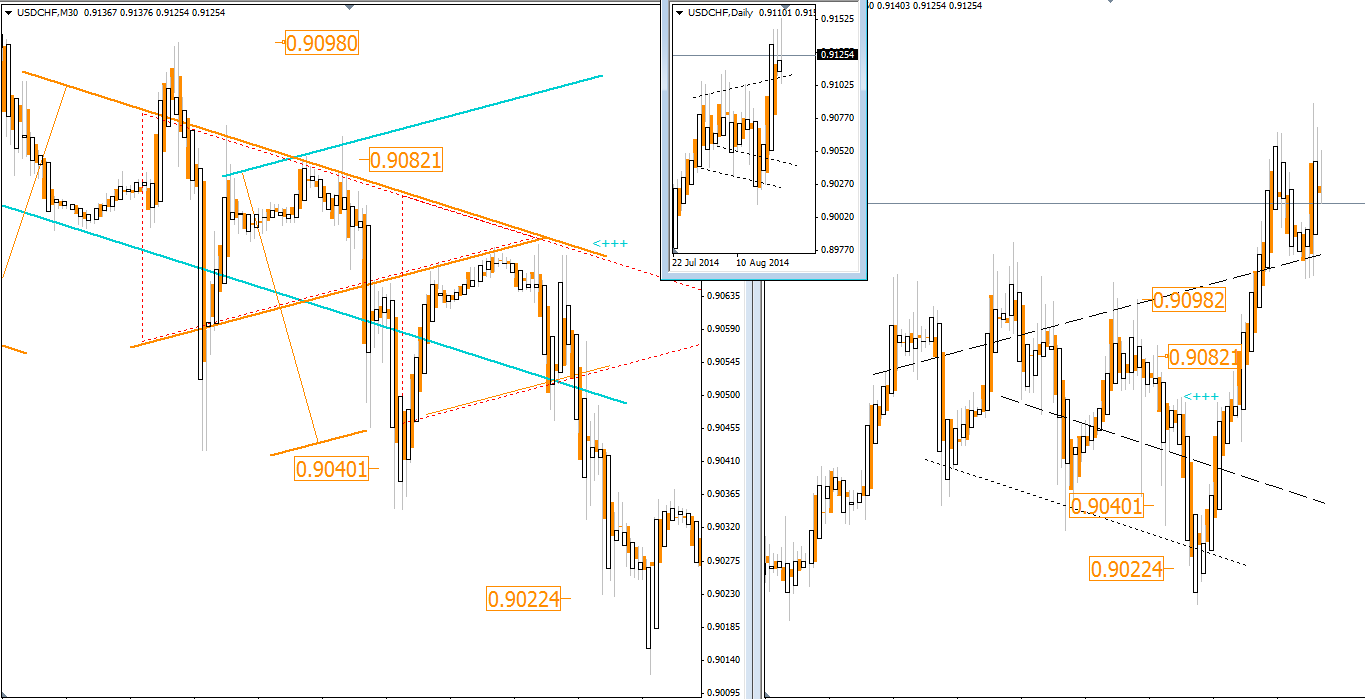
Captain Pugwash wrote:Wow - thanks mate
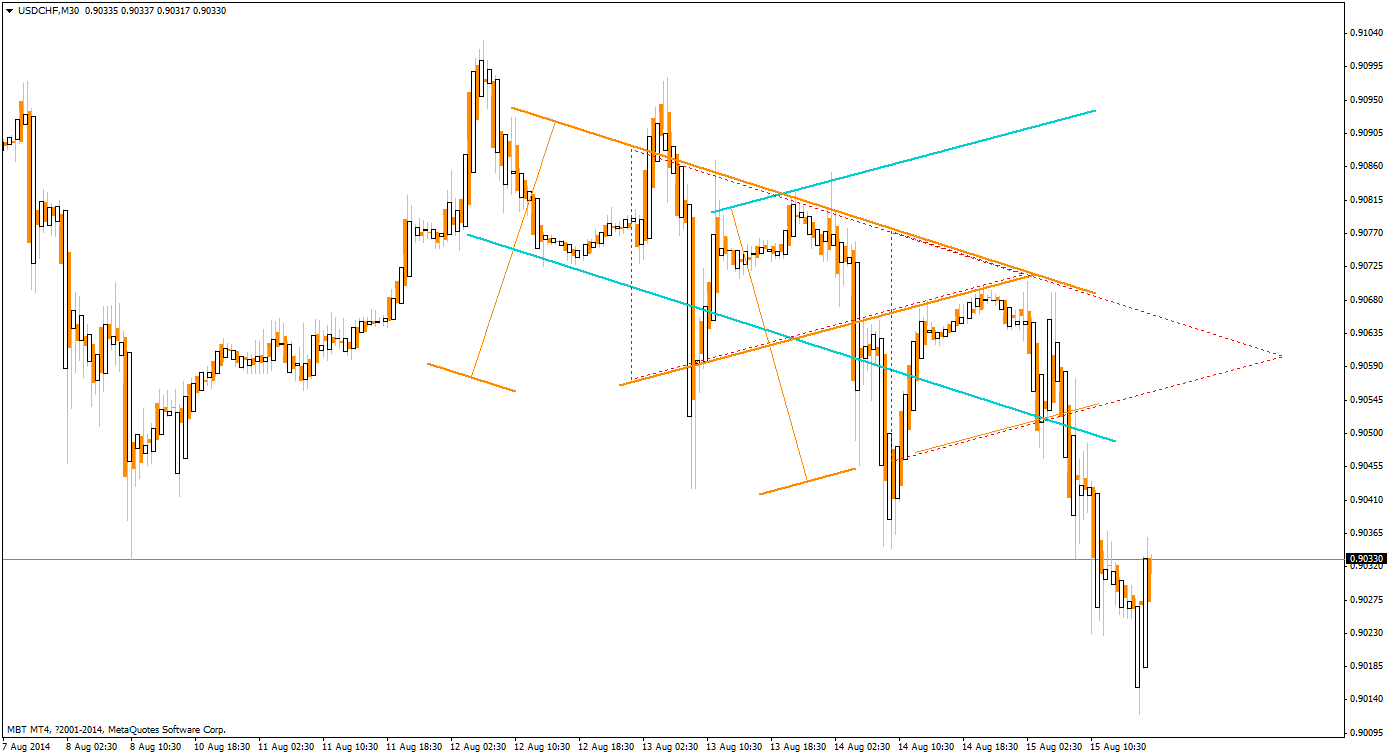
I had time to play with my own chart...
here is a 2nd markup of the same chart:
Moderator: moderators


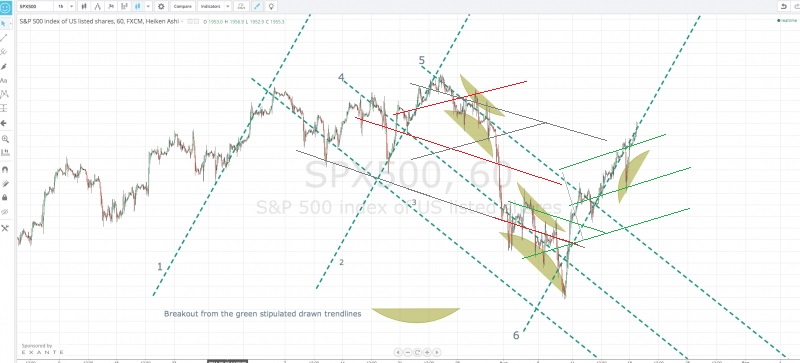
Pjort wrote:First I want to thank for Mo and other to contribute with their knowledge about trading - which I dont have that much of myself. (so how can I thank for their knowledge... hmmm ....) I do that anyway... Thank you!!!
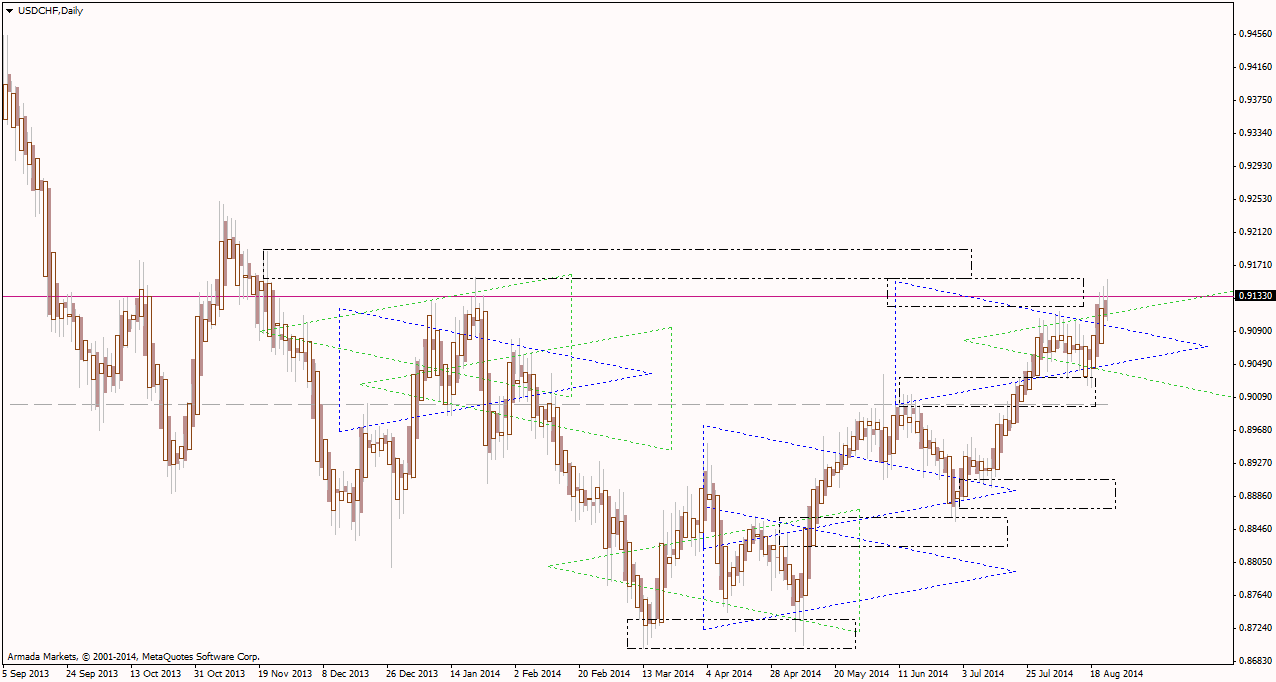
I have made this example of how I feel the triangle could look on the SP 500 chart - would you guys please give some feedback ??!
Best from Denmark
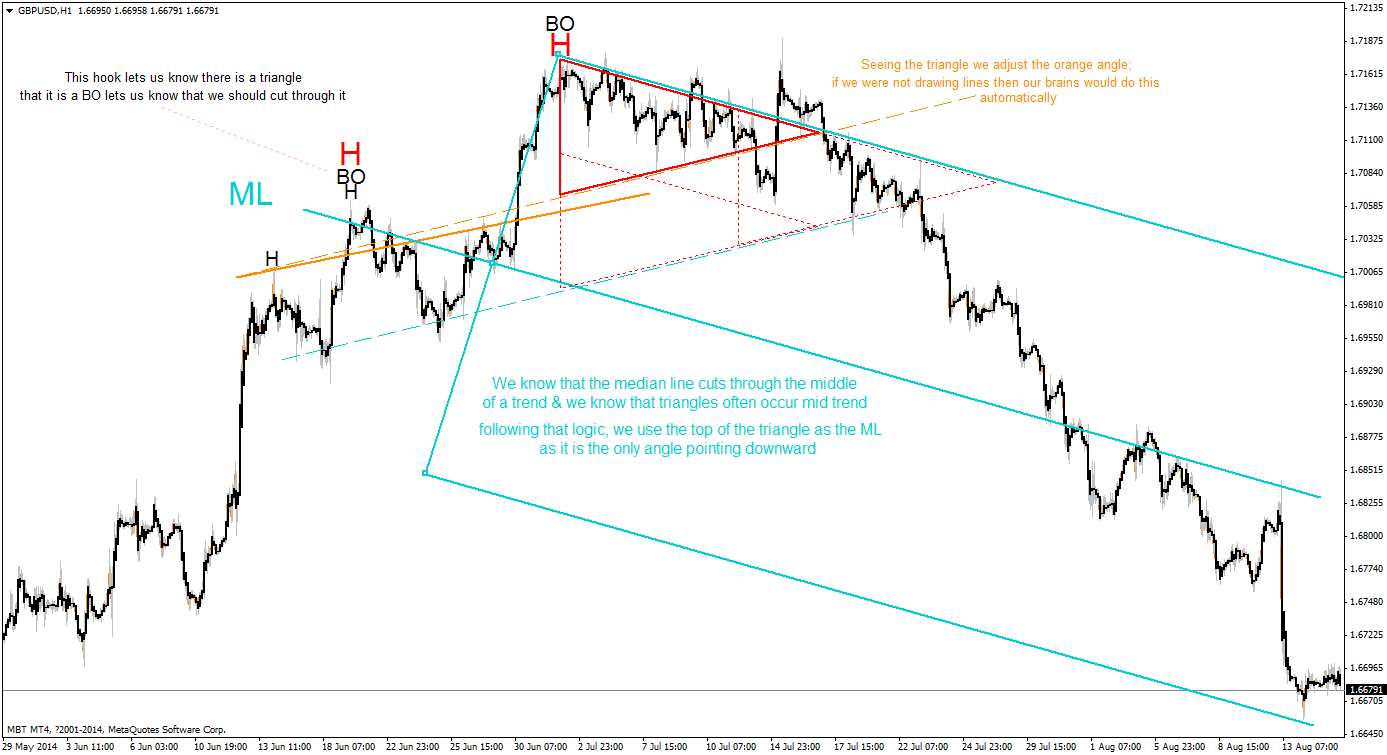
1) Price should be touching the top & bottom of your chart before you begin to draw your angles.
2) Start with an angle of ~15-20* and then adjust slightly based on what angles you see on the chart.
3) Start with one line, the top or bottom of a triangle/cone, and cut through a breakout.
4) Look for the other side of the triangle, if it is a cone you might see the "hand sliding" action that is the trademark of a cone or you might see a bounce and use median lines to find the other end.
5) Count the number of false breaks; the greater the number the more likely it is that you drew it correctly.
It is important that you don't try to contain the price action. There is channel speed and there is breakout speed (momentum, momentum candles, momo, mbar, whatever); both are important and should be segregated.
Pjort wrote:1) Price should be touching the top & bottom of your chart before you begin to draw your angles.
2) Start with an angle of ~15-20* and then adjust slightly based on what angles you see on the chart.
3) Start with one line, the top or bottom of a triangle/cone, and cut through a breakout.
4) Look for the other side of the triangle, if it is a cone you might see the "hand sliding" action that is the trademark of a cone or you might see a bounce and use median lines to find the other end.
5) Count the number of false breaks; the greater the number the more likely it is that you drew it correctly.
It is important that you don't try to contain the price action. There is channel speed and there is breakout speed (momentum, momentum candles, momo, mbar, whatever); both are important and should be segregated.
1. Seems to be no problem...
2. The angle - I guess it depend on how much you stretch the chart i.ex. how many days versus points is spread on x axes. At my drawing I am ended up with about 45 degree.
3. That I also figured out I believe.
4. This is difficult for me to understand - please elaborate... I guess my english i to poor as it is not my native language. Always a problem when I am reading abstract parts of trading methodoligies in english...
5. Seems like I got a lot of breakouts from line 4 and 5...
I will try to think more about channelspeed versus
breakout speed...
Many thanks for feedback...


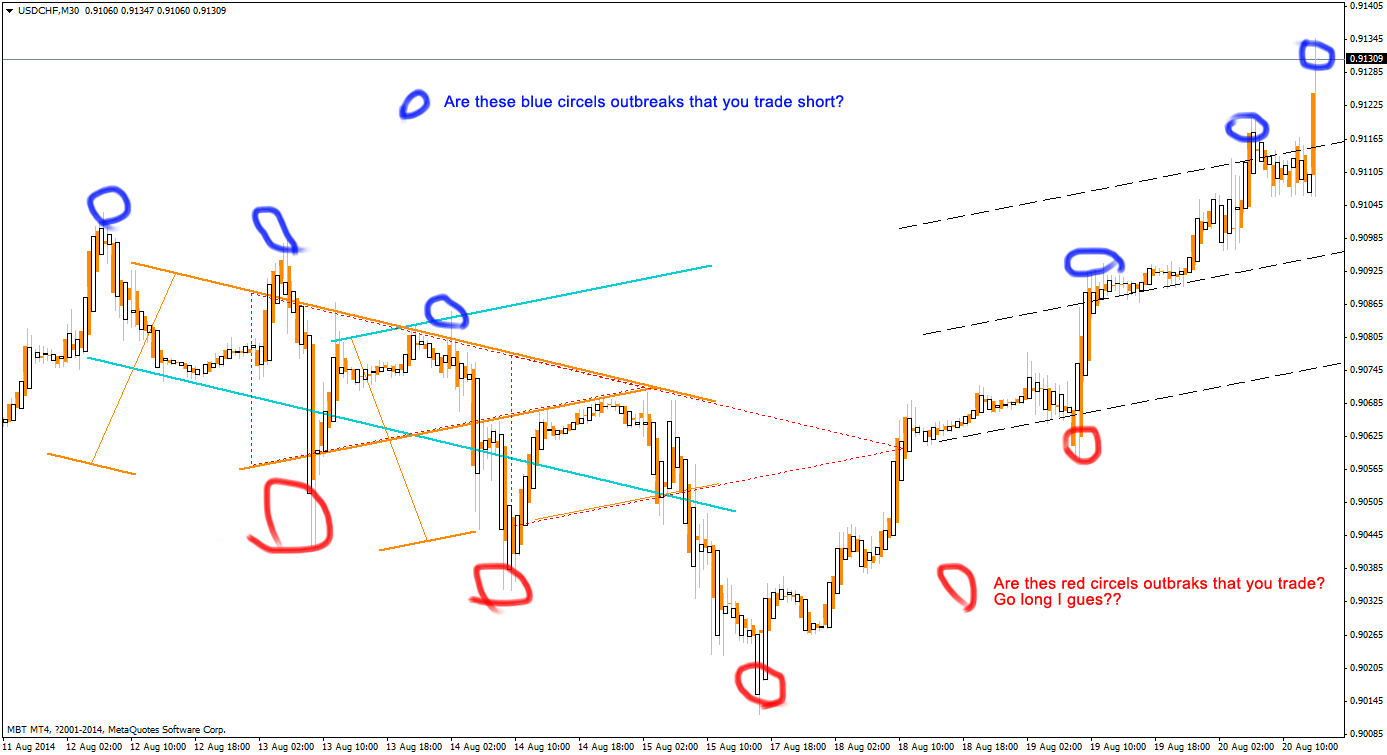
Pjort wrote:Pretty kewl stuff, I know

I have to ask!!

Jalarupa wrote:Pjort wrote:Pretty kewl stuff, I know
I have to ask!!
If I understand my forex guru; he would tell you that those are all areas where one "could" take action...
HOWEVER if you are not POSITIONED off of a Large Time Frame Extreme or in the direction of MOMO on the large Time Frame chart then you are setting yourself up for painful experiences...