Daily analysis from FXOpen

forex live trades, setups, charts

Moderator: moderators

User avatar
whiteking
rank: 150+ posts
rank: 150+ posts
Posts: 350
Joined: Fri Aug 11, 2017 2:25 am
Reputation: 32
Gender: None specified

Re: Daily analysis from FXOpen

Postby whiteking » Wed Feb 28, 2024 2:39 pm

Brent Crude Oil Makes Sudden Rally As OPEC Countries Mull Low Output
Image

Crude oil is a particularly unusual substance in that it is one of the only consumable commodities that institutions and private individuals widely trade across the spectrum of global markets, and it is a staple component as an energy resource in most aspects of everyday life, yet its value is maintained by a cartel made up of the central governments of the nations that extract it from the earth.

This combination of completely unique circumstances and operational conditions means that the requirement for crude oil to perform its task as a basis for fuels combined with the method by which the OPEC+ countries are able to control its price via aligning to reduce or increase production and distribution makes for an interesting marketplace.

This week, news surfaced across mainstream media around the possibility that the OPEC+ countries may consider an extension of the reduction in crude oil production and supply that is currently in place.

The current level of production and supply that has been set by the OPEC+ countries is subject to a reduction, which was agreed on in November 2022 during a meeting of the OPEC+ nations led by the Russian Federation. At that time, a reduction of approximately 2.2 million barrels of crude oil per day was agreed. However, this week, there has been some thought that the OPEC+ nations may consider extending this reduced amount of production into the second quarter of this year.

Fuel prices have steadily been rising on the consumer side, meaning that the cost of refined fuel oils has had to factor these reductions in, and perhaps motorists may have noticed that unleaded fuel and diesel oil for road vehicles have crept up in price very slightly over the past month or so, however, should the extension of a reduced output take place, the wider effect could make its way onto the financial markets, where oil is traded as a commodity.

Over the course of the past day, US Brent Crude Oil has risen in price dramatically. According to FXOpen charts, Brent Crude Oil concluded the trading day on February 26 at $80.51 per barrel, whereas it begins the trading day today at $82.24 per barrel.
Indicative pricing only

Image

That is quite a significant increase over the course of a short trading period.

There is no indication regarding how long these supply restrictions may remain in place. Therefore, the perspective of analysts and market participants is varied. One possible reason could be that this is a standard measure to bolster prices at a time during which there are logistical and political issues taking place across the Middle East, which in some respects can affect the trade of goods as shipping companies have scaled back distribution of products which require transportation via the Red Sea. Therefore, the Middle Eastern contingents of the OPEC+ countries need to strengthen their revenues from oil sales.

Some analysis looks at the possibility of the cuts being in place for the entirety of 2024 - but this is pure speculation.

Currently, volatility in the oil market makes for interesting reading, especially given the geopolitical considerations surrounding many of the OPEC+ countries.

This article represents the opinion of the Companies operating under the FXOpen brand only. It is not to be construed as an offer, solicitation, or recommendation with respect to products and services provided by the Companies operating under the FXOpen brand, nor is it to be considered financial advice.
I trade at FXOpen

Please add www.kreslik.com to your ad blocker white list.
Thank you for your support.

User avatar
whiteking
rank: 150+ posts
rank: 150+ posts
Posts: 350
Joined: Fri Aug 11, 2017 2:25 am
Reputation: 32
Gender: None specified

Re: Daily analysis from FXOpen

Postby whiteking » Fri Mar 01, 2024 2:24 pm

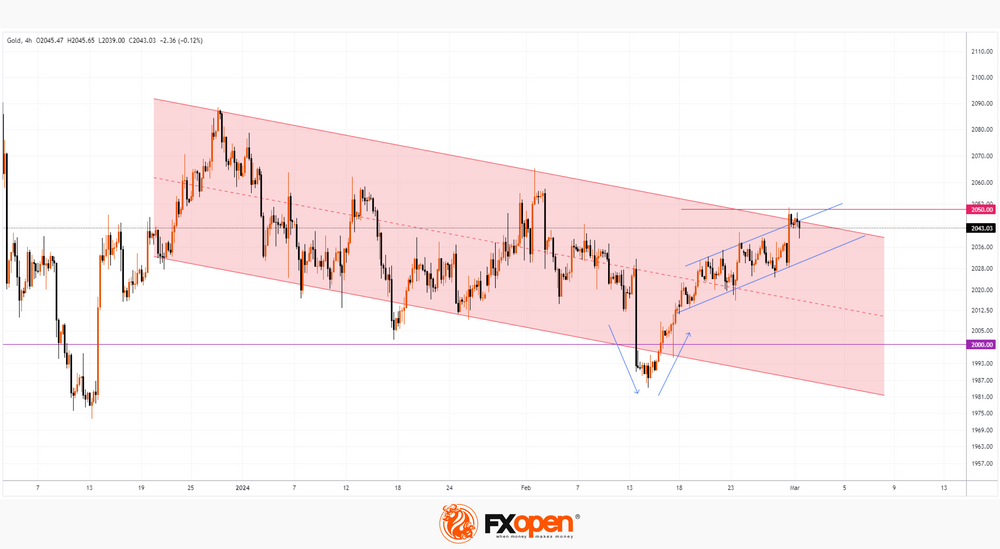
Price of Gold Briefly Exceeded $2,050 per Ounce
Image

In addition to new records in the stock markets, the reaction to yesterday's news about inflation in the US was also a decrease in government bond yields and a rapid rise in the price of gold — the cost of XAU/USD jumped by 0.9% in just one hour, while the day's high exceeded USD 2,050 per ounce .

However, on Friday morning the price of XAU/USD dropped below USD 2,040 – did market participants misjudge the impact of US inflation on the price of gold?

Image

XAU/USD chart shows that:
→ the price of gold is in a downward trend (shown in red);
→ yesterday, the price not only touched the psychological level of USD 2,050, but also reached the upper limit of the downward red channel. That is, both lines acted as a block of resistance, which appears to be a serious obstacle to the upward impulse (shown by blue lines).

A sharp change in sentiment (yesterday, positive, today, negative) may be similar to a sharp change in mood (in a mirror image) that happened in mid-February. As the blue arrows show, the negativity caused by the price falling below the psychological level of USD 2,000 within a few days was replaced by positive sentiment.

Therefore, it is possible that the activation of the bears, noticeable in the action of the price of gold this morning, may result in an attempt to resume the development of the market trend within the red channel. The nearest serious test of the seriousness of the bears' intentions may be the lower blue line, which worked as support in the second half of February.

This article represents the opinion of the Companies operating under the FXOpen brand only. It is not to be construed as an offer, solicitation, or recommendation with respect to products and services provided by the Companies operating under the FXOpen brand, nor is it to be considered financial advice.
I trade at FXOpen

User avatar
whiteking
rank: 150+ posts
rank: 150+ posts
Posts: 350
Joined: Fri Aug 11, 2017 2:25 am
Reputation: 32
Gender: None specified

Re: Daily analysis from FXOpen

Postby whiteking » Tue Mar 05, 2024 1:42 pm

NASDAQ Rally Shows Tech Stocks Are Back in Focus - But for How Long?
Image

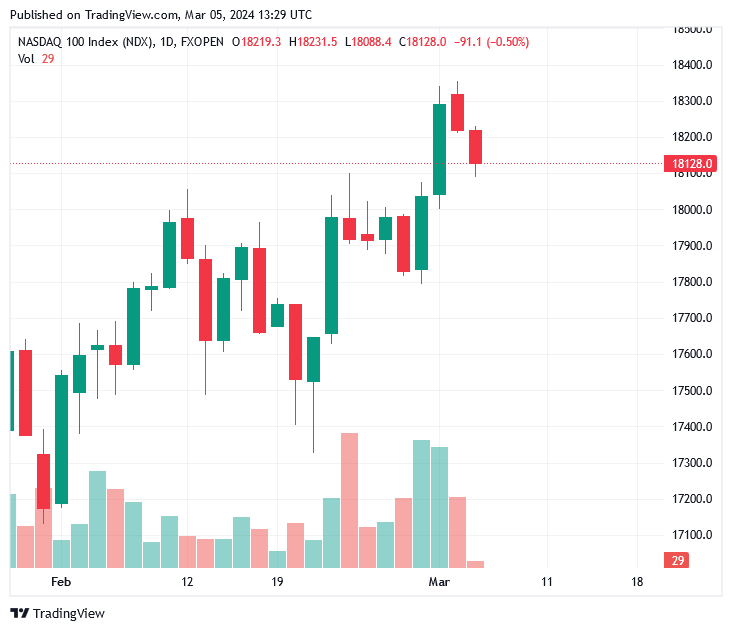
The NASDAQ index, well known as a premier listing venue for North American technology companies across the entire spectrum from the Silicon Valley giants to recently listed newcomers, has been going from strength to strength during the beginning part of this year.

At the beginning of January, the NASDAQ was resting at a relatively low point in the mid-16,300 range and has since risen to 18,318.7 at the high points of the trading day in New York yesterday, according to FXOpen pricing.

Image

This is a considerable increase, and apart from a few small dips along the way, it has been consistent for the majority of the first quarter of the year so far.

Yesterday's trading was of great interest to those with a keen penchant for US tech stocks, as the NASDAQ's high point of 18,318.7 represented an all-time record for the index, clearly demonstrating that these days, there is a clear distinction between enthusiasm among traders for NASDAQ-listed companies compared to two years ago when there was a sustained period of low value across NASDAQ listed stocks.

Those times are gone, and the halcyon days are back. However, the euphoria subsided slightly as the trading day came to a close yesterday during the US session, as the NASDAQ, despite a rallying group of technology stocks tied to the artificial intelligence boom keeping the values high, began to make a slight climbdown from its historic high.

Trading will begin today with the NASDAQ index standing at 18,129.1 according to the bottom of the candlestick on FXOpen charts, which is still high compared to the entire history of the NASDAQ index apart from the levels it reached during yesterday's trading.

Some of the contributors to NASDAQ's highs have been long-established computer technology giants which have been pioneering AI, an example being NVIDIA, a company traditionally synonymous with the manufacture of graphics cards, which had huge traction during the cryptocurrency mining boom last decade and sustained popularity among gamers around the world.

NVIDIA stock has boomed over the past month, with some sources quoting a 22.9% increase in stock value, therefore being a significant component within NASDAQ's listed giants, which is contributing to the index's recent resurgence.

As featured in the Top 5 Stocks for March 2024, Coinbase has been doing exceptionally well, a firm whose performance has also benefited the overall stature of the NASDAQ index within which it is a component.

It could be worth considering that Tesla, with its recent introduction of discounts across its electric vehicle range having been published as this week began, placing it in direct competition in the all-important Chinese market with local manufacturer BYD and Apple, an equally important mainstay of the NASDAQ index slipping in value slightly after finding itself at the end of antitrust litigation which cost the company $1.95 billion in fines relating to allegedly abusing its dominant position in the music streaming application sector.

Overall, there is a dichotomy between the high performers, as described here, and those making lower values, which are often represented by firms which entered the NASDAQ exchange listing process via blank cheque 'SPAC' listings in 2021.

Therefore, the tech stock arena is continually interesting, given its range of highly capitalised Silicon Valley household names and intriguing upstarts compared to the more bricks-and-mortar, establishment-oriented representation on traditional exchanges such as the London Stock Exchange.

This minor volatility is indeed minor but is of great interest given the high point reached by NASDAQ this week.

This article represents the opinion of the Companies operating under the FXOpen brand only. It is not to be construed as an offer, solicitation, or recommendation with respect to products and services provided by the Companies operating under the FXOpen brand, nor is it to be considered financial advice.
I trade at FXOpen

User avatar
whiteking
rank: 150+ posts
rank: 150+ posts
Posts: 350
Joined: Fri Aug 11, 2017 2:25 am
Reputation: 32
Gender: None specified

Re: Daily analysis from FXOpen

Postby whiteking » Wed Mar 06, 2024 1:44 pm

TSLA Stock Price Falls Over 9% in Just 2 Days
Image

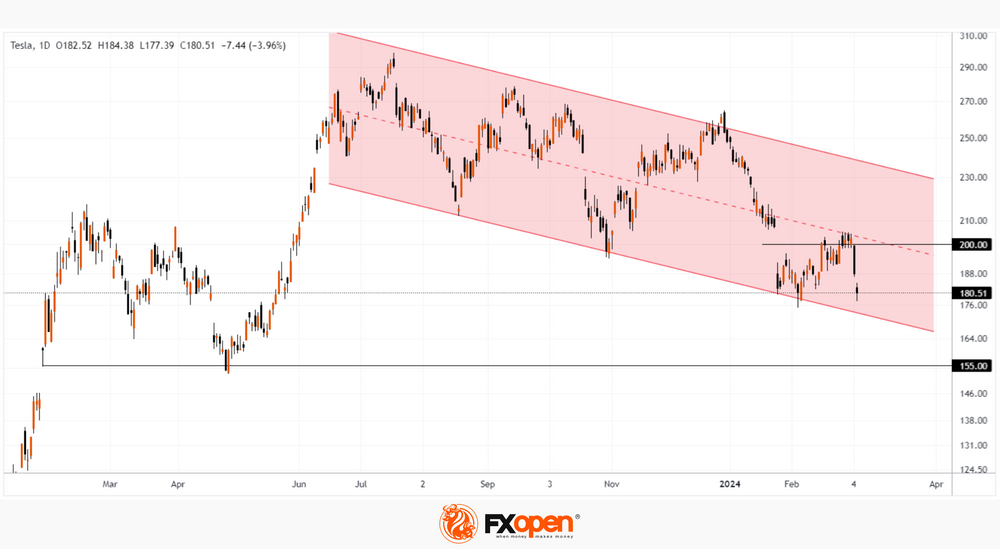
The day before yesterday, trading in TSLA shares began at an opening price of USD 199.34; trading yesterday closed at a price of USD 180.51. The fall in TSLA shares led Musk to lose the title of the world's richest man to Jeff Bezos.

The main driver of the decline in the price of TSLA shares was news:
→ about the temporary shutdown of the Giga Berlin plant in Germany after an arson set by a group claiming that the company led by Elon Musk is devouring “land, resources, people”;
→ that deliveries of electric cars from the Shanghai plant have dropped to their lowest level in more than a year — which may indicate fierce competition with Chinese manufacturers.

It also became known that Morgan Stanley analyst Adam Jonas is lowering his target price from USD 345 to USD 320 and predicting a decline in sales for FY24.

Image

Technical analysis of the TSLA stock chart shows that:
→ The TSLA stock price is moving in a downward channel (shown in red), acting noticeably weaker than the broader market.
→ In March, the median line acted as resistance.
→ The price was unable to consolidate above the round level of USD 200 (in November last year it worked as support).

If the bearish momentum continues, TSLA price could reach the channel's lower boundary around USD 170, renewing its 2024 low. Even lower is important support at USD 155, formed from a gap last January and tested in April.

On the other hand, the current decline may turn into a profitable opportunity in the long term.

As it became known this week, Cathie Wood's ARK funds are increasing their long positions in TSLA shares. And respected analyst Daniel Ives said on CNBC that Tesla's growth story isn't dead and it's just going through a "brutal transition" that could be linked to deteriorating communication due to the company replacing its chief financial officer last year..

This article represents the opinion of the Companies operating under the FXOpen brand only. It is not to be construed as an offer, solicitation, or recommendation with respect to products and services provided by the Companies operating under the FXOpen brand, nor is it to be considered financial advice.
I trade at FXOpen

User avatar
whiteking
rank: 150+ posts
rank: 150+ posts
Posts: 350
Joined: Fri Aug 11, 2017 2:25 am
Reputation: 32
Gender: None specified

Re: Daily analysis from FXOpen

Postby whiteking » Wed Mar 13, 2024 1:49 pm

Today Is an Ethereum Update. ETH/USD Is Above $4,000

Image

An update is scheduled for the Ethereum network today, approximately at 16:55 GMT+3.

The update is called Dencun and is the biggest code change since April 2023, when the Shapella update was implemented.

Dencun aims to reduce fees on the growing array of ancillary networks running on top of Ethereum, called layer 2 (L2) “aggregates.” The changes involve “proto-dunksharding” technology, which is intended to improve the blockchain’s ability to process data from L2 networks.

It is believed that the implementation of the update will give impetus to the development of projects built on auxiliary networks. On the other hand, there is a risk of failures. Although it is worth noting that Dencun was deployed three times on test networks, and each time there were no problems.

Image

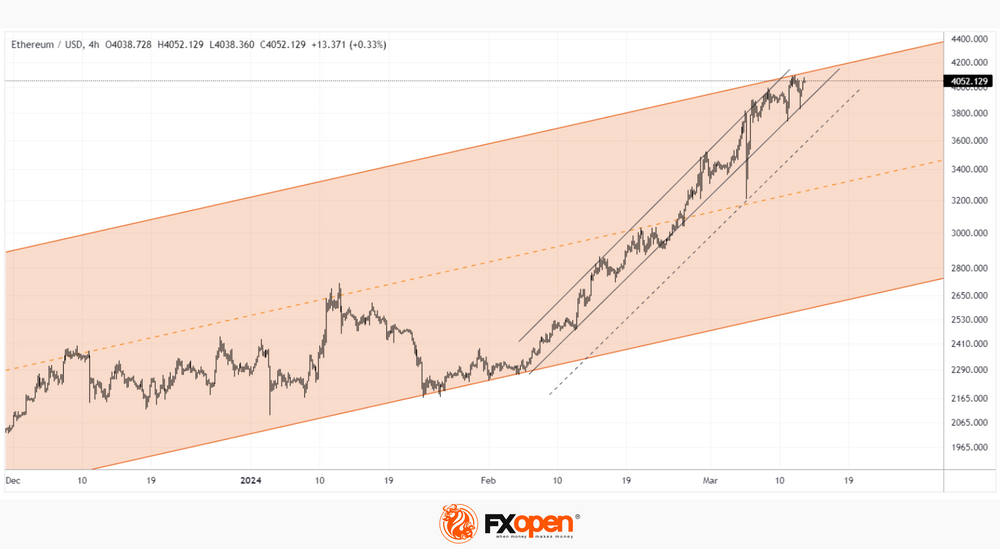
The ETH/USD chart shows that the price of Ethereum today, on the day of the update, is showing bullish behavior:
→ the price moves within the long-term ascending channel (shown in orange). Having pushed off from its lower limit in early February, the price of ETH has already reached its upper limit, which is +76% in about a month!
→ during the growth, the price formed an ascending channel (shown by black lines);
→ the price is trying to consolidate above the psychological level of USD 4,000 for Ethereum.
→ long lower shadows on the candles on March 11-12 give reason to believe that there is strong demand in the market amid news related to an important update for the development of Ethereum.

Reaching the upper boundary of the channel is an argument in favor of a consolidation scenario after a significant rally. But it is possible that using the hype, the bulls will try to storm the upper border of the channel. If successful, the area around USD 4,000 could act as an important support for ETH/USD in the future.

FXOpen offers the world's most popular cryptocurrency CFDs*, including Bitcoin and Ethereum. Floating spreads, 1:2 leverage — at your service. Open your trading account now or learn more about crypto CFD trading with FXOpen.

*At FXOpen UK and FXOpen AU, Cryptocurrency CFDs are only available for trading by those clients categorised as Professional clients under FCA Rules and Professional clients under ASIC Rules respectively. They are not available for trading by Retail clients.

This article represents the opinion of the Companies operating under the FXOpen brand only. It is not to be construed as an offer, solicitation, or recommendation with respect to products and services provided by the Companies operating under the FXOpen brand, nor is it to be considered financial advice.
I trade at FXOpen

Please add www.kreslik.com to your ad blocker white list.
Thank you for your support.

User avatar
whiteking
rank: 150+ posts
rank: 150+ posts
Posts: 350
Joined: Fri Aug 11, 2017 2:25 am
Reputation: 32
Gender: None specified

Re: Daily analysis from FXOpen

Postby whiteking » Thu Mar 14, 2024 2:02 pm

US500: The Market Has Been Growing without Corrections by 2% for 266 Consecutive Trading Sessions
Image

The S&P 500 remains in its longest rally since 2018 without a decline of at least 2%, according to data compiled by Bloomberg; analysts note that there hasn't been a correction of this size in 266 trading sessions.

The positive sentiment of market participants is due to:
→ the prospect of lowering interest rates by the Federal Reserve;
→ enthusiasm for AI and its positive impact on economic development.

However, although the fundamental background is strong, current estimates of the US500 index may be overestimated — in fact, this is the essence of the correction.

Image

The US500 chart shows that:
→ the price is in an upward trend (shown by the blue channel);
→ the price moves in the upper half of the channel, and the median line acts as support — a sign of strong demand;
→ on the morning of March 14, the market is showing signs of positivity, indicating that an attempt to overcome the resistance of 5,200 points and take a new record high may be made in the near future.

However, the MACD is holding back optimism — the popular oscillator is forming a bearish divergence pattern, which hints at the gradual fading of bullish impulses.

Given the above, bulls should be cautious as the market looks vulnerable to a correction, such as to the lower border of the channel. But this requires a trigger. One of these could be news about inflation in the US; the values of the Producer Price Index (as well as data on retail sales in the US) will be published today at 15:30 GMT+3. Be prepared for spikes in volatility.


This article represents the opinion of the Companies operating under the FXOpen brand only. It is not to be construed as an offer, solicitation, or recommendation with respect to products and services provided by the Companies operating under the FXOpen brand, nor is it to be considered financial advice.
I trade at FXOpen

User avatar
whiteking
rank: 150+ posts
rank: 150+ posts
Posts: 350
Joined: Fri Aug 11, 2017 2:25 am
Reputation: 32
Gender: None specified

Re: Daily analysis from FXOpen

Postby whiteking » Fri Mar 15, 2024 2:27 pm

Market Analysis: Gold Price Rally Takes Break, Crude Oil Price Surges
Image

Gold price rallied above $2,180 before correcting lower. Crude oil price is rising and it could climb further higher toward the $82 resistance.

Important Takeaways for Gold and Oil Prices Analysis Today
  • Gold price failed to clear the $2,200 resistance and corrected lower against the US Dollar.
  • A key bearish trend line is forming with resistance at $2,170 on the hourly chart of gold at FXOpen.
  • Crude oil prices are moving higher above the $80.00 resistance zone.
  • There is a connecting bullish trend line forming with support near $80.60 on the hourly chart of XTI/USD at FXOpen.

Gold Price Technical Analysis

On the hourly chart of Gold at FXOpen, the price was able to climb above the $2,150 resistance, as mentioned in the previous analysis. The price even broke the $2,180 level before the bears appeared.

The price traded close to the $2,200 zone before there was a downside correction. There was a move below the $2,180 pivot zone. The price settled below the 50-hour simple moving average and RSI dipped below 50. Finally, it tested the $2,150 zone.

Image

The price is now consolidating losses near the $2,160 level. Immediate resistance on the upside is near the $2,166 level or the 50% Fib retracement level of the downward move from the $2,179 swing high to the $2,152 low.

The next major resistance is near a key bearish trend line at $2,170. It is close to the 61.8% Fib retracement level of the downward move from the $2,179 swing high to the $2,152 low.

An upside break above the $2,170 resistance could send Gold price toward $2,180. Any more gains may perhaps set the pace for an increase toward the $2,200 level. If there is no recovery wave, the price could continue to move down.

Initial support on the downside is near the $2,164 level. The first major support is $2,150. If there is a downside break below the $2,150 support, the price might decline further. In the stated case, the price might drop toward the $2,132 support.

Oil Price Technical Analysis

On the hourly chart of WTI Crude Oil at FXOpen, the price started a decent increase against the US Dollar. The price gained bullish momentum after it broke the $78.20 resistance.

There was a sustained upward move above the $79.20 and $80.00 levels. The bulls pushed the price above the 50-hour simple moving average and the RSI climbed toward 65. A high was formed near $81.00 before there was a downside correction.

Image

The price is still stable above the 23.6% Fib retracement level of the upward move from the $76.48 swing low to the $81.02 high. However, the bulls are active above a connecting bullish trend line with support near $80.60.

Immediate resistance is near the $81.00 level. If the price climbs further higher, it could face resistance near $82.00. The next major resistance is near the $83.20 level. Any more gains might send the price toward the $85.00 level.

Conversely, the price might correct gains and test the 61.8% Fib retracement level of the upward move from the $76.48 swing low to the $81.02 high at $78.20.

The next major support on the WTI crude oil chart is near $76.50. If there is a downside break, the price might decline toward $75.00. Any more losses may perhaps open the doors for a move toward the $73.50 support zone.

This article represents the opinion of the Companies operating under the FXOpen brand only. It is not to be construed as an offer, solicitation, or recommendation with respect to products and services provided by the Companies operating under the FXOpen brand, nor is it to be considered financial advice.

RISK WARNING: Trading on the Forex market involves substantial risks, including complete possible loss of funds and other losses and is not suitable for all members. Clients should make an independent judgement as to whether trading is appropriate for them in the light of their financial condition, investment experience, risk tolerance and other factors.
I trade at FXOpen

User avatar
whiteking
rank: 150+ posts
rank: 150+ posts
Posts: 350
Joined: Fri Aug 11, 2017 2:25 am
Reputation: 32
Gender: None specified

Re: Daily analysis from FXOpen

Postby whiteking » Mon Mar 18, 2024 2:52 pm

BTC/USD Analysis: Bears Have Become More Active Near the $70,000 Level
Image

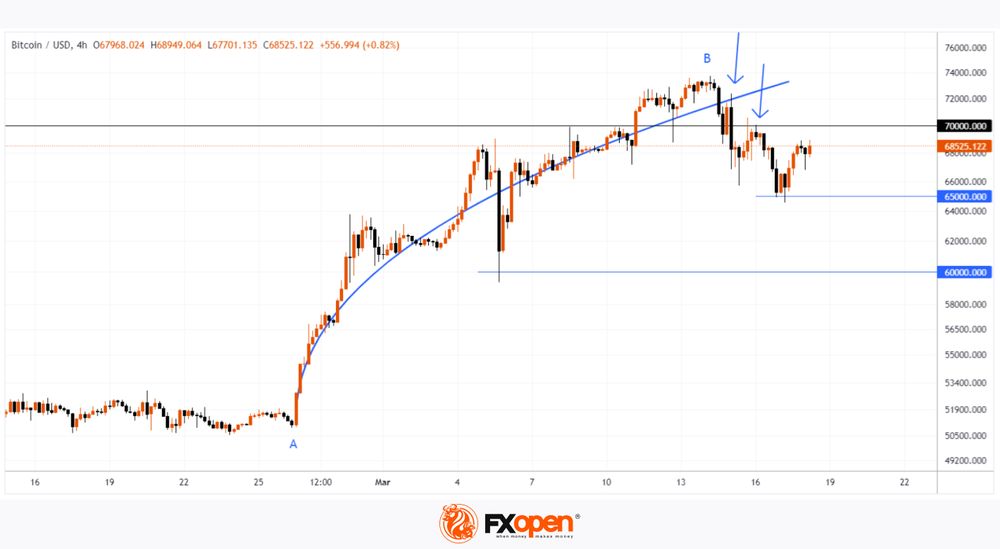
On February 26 (A), a strong bullish impulse started in the Bitcoin market. Its trajectory is visually described by a blue line. The price of bitcoins developed along it — this can be interpreted in such a way that market participants agreed that the value of the cryptocurrency was increasing.

If the price of Bitcoin deviated from the blue line, it was only for a short period of time. For example, to pierce the psychological level of USD 60,000 on March 5th.

Image

However, the bullish momentum changed on March 15th, and this can be seen on the BTC/USD chart today:
→ the blue line began to work as resistance (shown by the first arrow);
→ the level of USD 70,000 also began to act as resistance (shown by the second arrow).

BTC price briefly deviated from breaking through the psychological USD 65,000 level - but it appears that due to said resistances, bulls may now have trouble getting Bitcoin price back onto the upward trajectory shown by the blue line.

This could mean that the market's consensus on the value of BTC has changed - the chart suggests that a price of over USD 70k per Bitcoin may be considered overpriced (not surprising after A→B's rise of over 40% in 14 days).

On the other hand, demand remains high ahead of the halving (scheduled for April 19).

According to Matt Hougan (a top executive at Bitwise, one of the BTC ETF providers), about 40% of independent registered financial advisors at Barron's Summit owned Bitcoin. And this number among their clients is about 5-10%, which leaves potential for further growth.

Matt Hougan also noted the growing concern about the huge US government debt, and Bitcoin in this case acts as an insurance asset.

Given the strong fundamentals and signs of technical weakness near the last historical high, it is reasonable to assume that the price of Bitcoin may form some kind of consolidation zone around USD 70,000, thereby suggesting the levels that most market participants consider a fair price for Bitcoin at the moment.

*At FXOpen UK and FXOpen AU, Cryptocurrency CFDs are only available for trading by those clients categorised as Professional clients under FCA Rules and Professional clients under ASIC Rules respectively. They are not available for trading by Retail clients.

RISK WARNING: Trading on the Forex market involves substantial risks, including complete possible loss of funds and other losses and is not suitable for all members. Clients should make an independent judgement as to whether trading is appropriate for them in the light of their financial condition, investment experience, risk tolerance and other factors.[

This article represents the opinion of the Companies operating under the FXOpen brand only. It is not to be construed as an offer, solicitation, or recommendation with respect to products and services provided by the Companies operating under the FXOpen brand, nor is it to be considered financial advice.
I trade at FXOpen

Please add www.kreslik.com to your ad blocker white list.
Thank you for your support.


Return to “forex”