Pro
thank you so much for sharing your insight. I hope that you are making the big pips my man! : D
simple, tradable, awesome statistics
Moderator: moderators
Please add www.kreslik.com to your ad blocker white list.
Thank you for your support.
Thank you for your support.
-
deltaskelta
- rank: 50+ posts

- Posts: 56
- Joined: Tue Jul 03, 2012 10:08 pm
- Reputation: 4
- Gender:

- Contact:
prochargedmopar wrote:Price is the same on ALL time frames
So,
Every time frame MUST also be the same.
*check*
It makes NO difference what indicator/s you use (even if it is a candlestick) as they are all SLAVES to PRICE.
Think about it.
As MO says, price is either close above/below "something".
If you focus and watch for the largest correction that does NOT return to the extreme you will be able to peer into HIS crystal ball.
Oh, and a monthly chart wouldn't hurt. LOL
You would NOT believe the information you are given when you first ask bredin's famous question:
Where am I going?
It brings Peace to your trading.
"As MO says, price is either close above/below "something".
If you focus and watch for the largest correction that does NOT return to the extreme you will be able to peer into HIS crystal ball. "
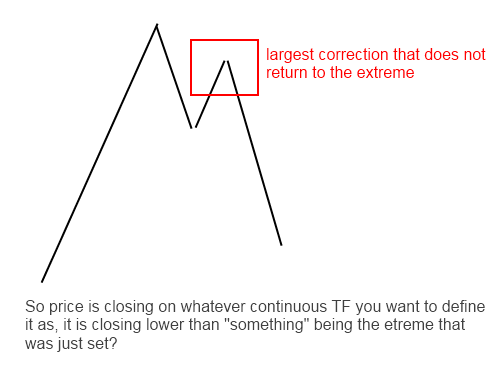
By not returning to an extreme, you are saying that it is closing higher than "something" being the extreme in a larger sense of time, right?
something like this:

Also, can someone please expand upon this:
"Where am I going?
It brings Peace to your trading." I'm not sure what exactly is meant by this
http://www.radbrains.com - My Trade Log
-
Relativity
- rank: 150+ posts

- Posts: 364
- Joined: Mon Nov 15, 2010 4:19 pm
- Reputation: 0
- Gender:

Relativity wrote:deltaskelta wrote:Relativity wrote:deltaskelta wrote:So, relativity had given me the idea of studying time as well, and I had never thought of doing that before.
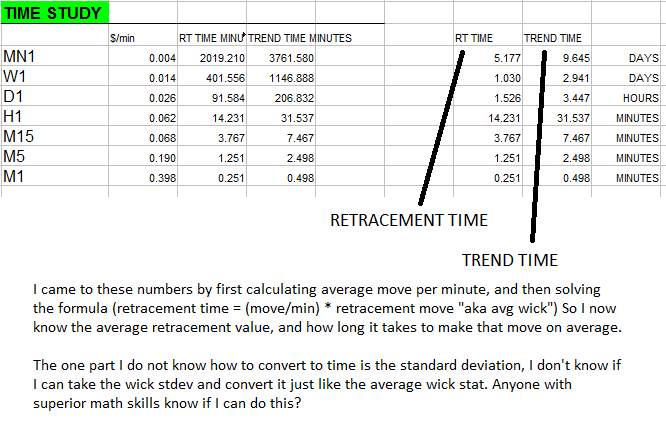
So I decided to do a time study to find out how long these moves take on average to make.
Here are the results:
What I am trying to grasp is : what is the significance of space and time together in this sense? Obviously if I see an uptrend that takes the perfect amount of time and space retracement, then its probably a green light.
But, I don't know Im just trying to figure out what it's all telling me.
Anyone have any input?
I wouldn't go there too deeply about time and space without considering market participant makeup thou. Why?
I have 3 classes of 'indicators'
LIVE - my primary tools = main reasons for entry
ODDS - my secondary tools = only to pinpoint entries / exits + look for increased probability of trades
STATS - basic research that held its water, description of PA via stats
Doing these stats are going to be useful, but I would keep the eventual results / tools somewhere in between ODDS and STATS. Hope you get what I mean.
FYI check Nature of Trends page 69 / 70.
hmm I do know what you mean here about the odds and stats, but I'm confused as to what your live or primary tools would be.
Could you give an example just for clarity?
Primary tools e.g. :
Psychological lines / rounded numbers
Current D1 and W1 high / low / open on a H1 chart
Barros Swings
Market Profile


Some stuff is hidden thou. Only want to show when needed.
-
Relativity
- rank: 150+ posts

- Posts: 364
- Joined: Mon Nov 15, 2010 4:19 pm
- Reputation: 0
- Gender:

speed26 wrote:I cant understand this issue with higher/smaller timeframes and which one is faster/slower. Everything begins from the tick, so in a sense the tick itself is the source (the begining) of all other moves (TF's just package the information).
All timeframes do the exact same thing and any TF shows what is going on above it and below it (higher or lower TF). How? The 'price-quote' on the right hand side of your chart, it shows the current price, irrelevant of TF your looking at. That 'quote' right there tells you what price is doing "right-now", and it has equal potential to either go up or go down, simply because the quote itself represents the current moment (hence the term trade the 'now', follow but dont predict) and price HAS to move one way or the other.
Velocity, Displacement, Acceleration et all are derivatives of price but the bottom line is that any currency "pair" that you trade is affected by 2 parties: The base currency and quote currency.
The whole FX market is composed of money, and the sum of this money will "flow" from one particular currency into another (wax on-wax off).
This flow of money will dictate the magnitude of any and all moves and if done properly (which im still trying to do! lol) will increase odds of "catching" better price movements meanwhile eliminating with higher odds the erratic moves.
Any indicator thrown on a chart has a purpose and does what it is built to do, but if the underlying force of the WHOLE FX market is NOT supporting that currency move, then, it will continue to produce false signals.
Maybe im on a rant (out of frustration learning haha) but thought id share this here because the OP is doing what everybody should do - apply statistical analysis to the market.


This should answer your questions regarding money flow and underlying force.
-
Relativity
- rank: 150+ posts

- Posts: 364
- Joined: Mon Nov 15, 2010 4:19 pm
- Reputation: 0
- Gender:

Please add www.kreslik.com to your ad blocker white list.
Thank you for your support.
Thank you for your support.
-
deltaskelta
- rank: 50+ posts

- Posts: 56
- Joined: Tue Jul 03, 2012 10:08 pm
- Reputation: 4
- Gender:

- Contact:
Relativity wrote:http://goodmanworks.com/resources/ForexPropensityArticle.doc
I have this article, and I have added it to my reading list. I will continue actively posting and developing my statistics as I started to in here, I have jut gotten really busy lately. Thanks for sharing your charts relativity they always take me a while to figure out whats going on.
I like mine naked like my women.
http://www.radbrains.com - My Trade Log
Please add www.kreslik.com to your ad blocker white list.
Thank you for your support.
Thank you for your support.


