"I would look at backtesting results for an ATR threshold that gives an optimized expectancy."
Expectancy of what exactly?
Rather than optimizing, I prefer looking at frequency distributions.
" When flat, or nearly flat - no trades"
Can you define nearly flat? Didn't I code a slope indicator multimeter or something years ago??
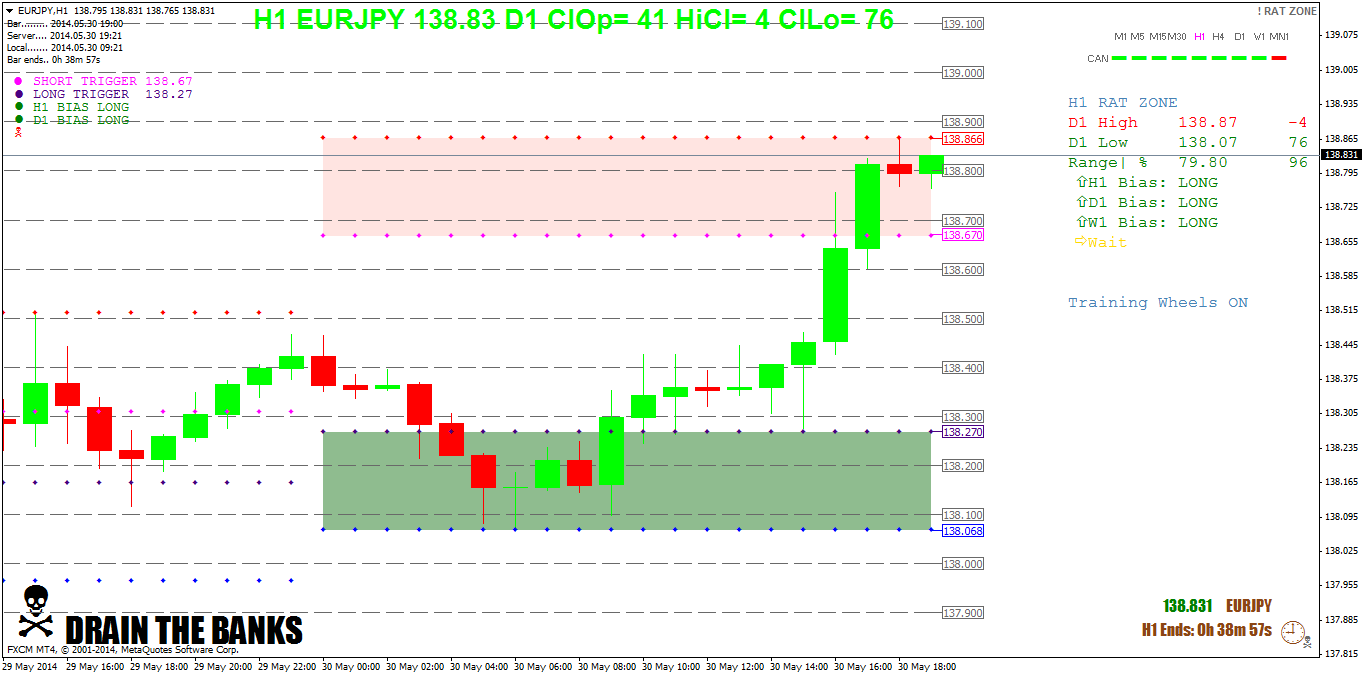
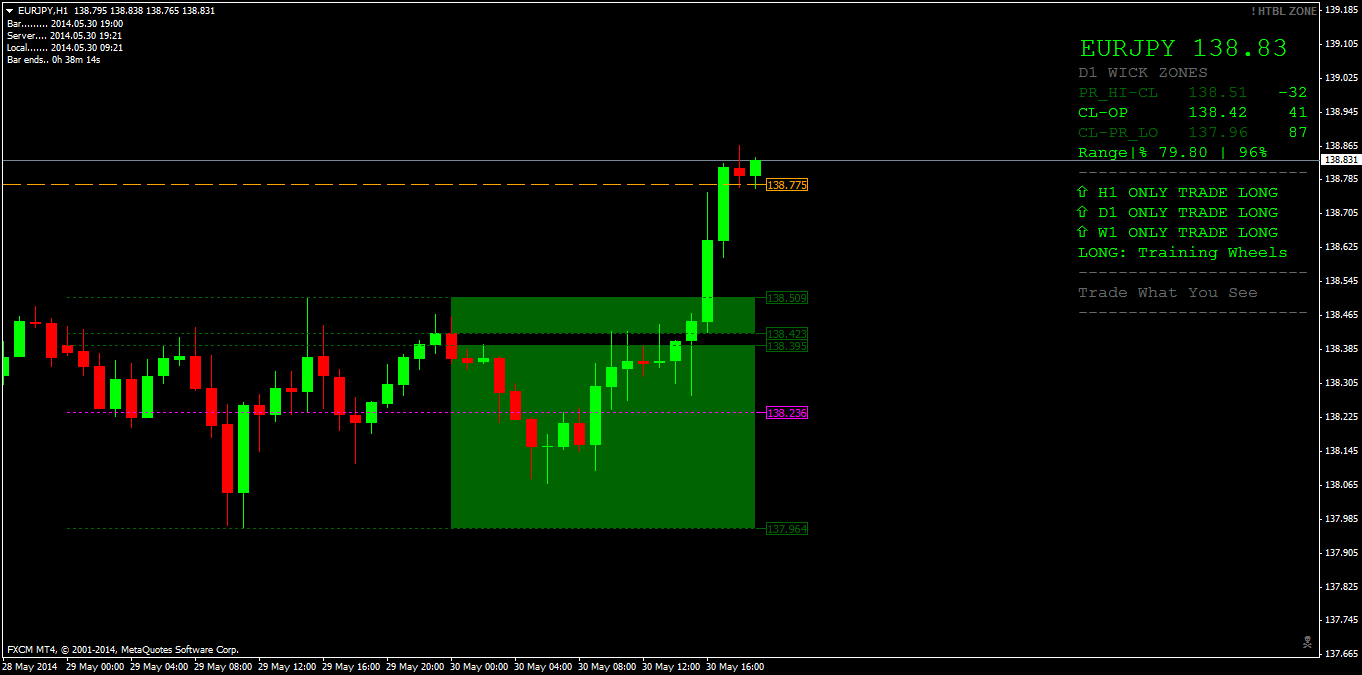
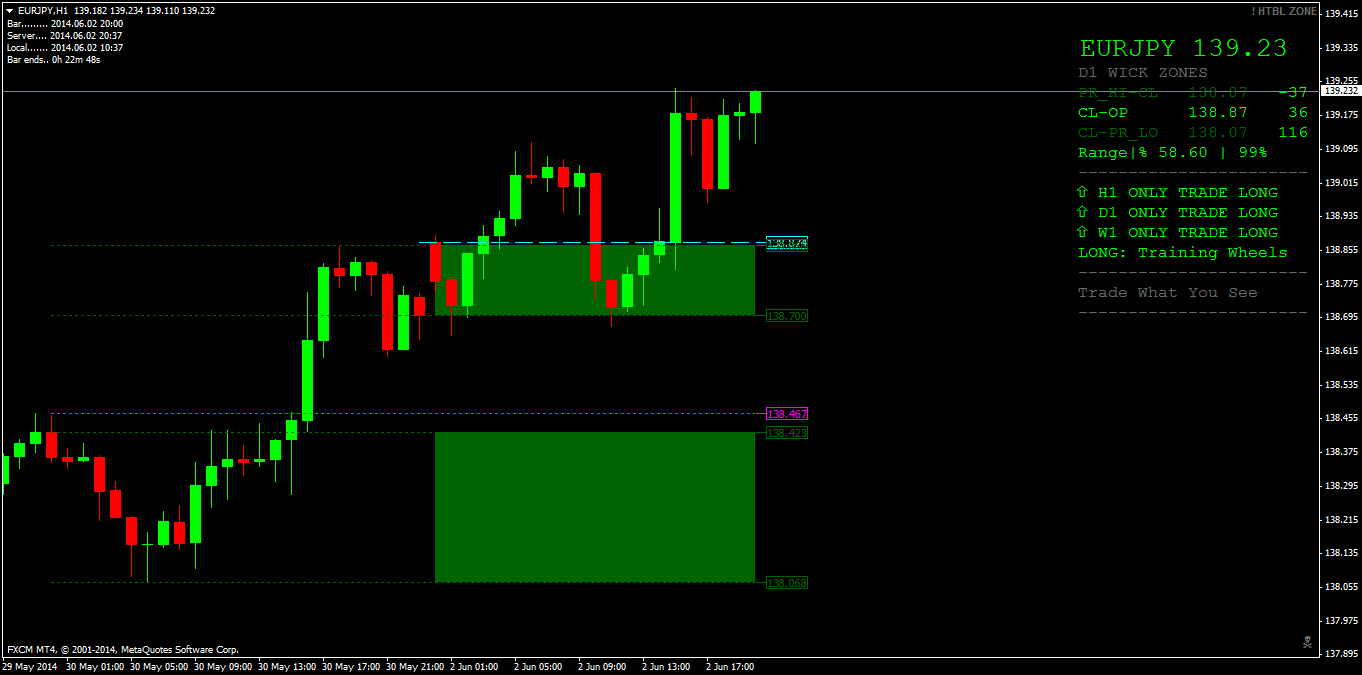
DAILY WICK ZONE TRADING
Moderator: moderators
- TheRumpledOne
- rank: 10000+ posts

- Posts: 15734
- Joined: Sun May 14, 2006 9:31 pm
- Reputation: 3046
- Location: Oregon
- Real name: Avery T. Horton, Jr.
- Gender:

- Contact:
Please add www.kreslik.com to your ad blocker white list.
Thank you for your support.
Thank you for your support.
- RicG
- rank: 150+ posts

- Posts: 274
- Joined: Tue Jul 24, 2007 11:44 pm
- Reputation: 8
- Location: Nashville, TN
- Gender:

TheRumpledOne wrote:"I would look at backtesting results for an ATR threshold that gives an optimized expectancy."
Expectancy of what exactly?
Rather than optimizing, I prefer looking at frequency distributions.
" When flat, or nearly flat - no trades"
Can you define nearly flat? Didn't I code a slope indicator multimeter or something years ago??
Answer to question 1) Expectancy of positive (and higher) win/loss%/risk/reward ratio as opposed to expectancy of negative win/loss%/risk/reward
Answer to question 2) Well, a "flat slope" (think thats an oxymoron...lol), would be a 0 degree angle. So running multiple frequency distributions starting at slightly above that, say at 3%, 5%, 7%, 9% and on up should show the optimal levels at which the win/loss%/risk/reward shows a positive expectancy. The results might find that from 0% to a low level, for discussion let's just say 15%, entries are much more likely to be losers, whereas a level from 16% to 70% might give a great winning expectancy. Then I would think at some point as the slope level gets too high, let's say, above 70%, you willl see the win/loss%/risk/reward expectancy turning negative due to price exhaustion.
And I have no idea if you coded a slope indicator multimeter years ago. Seems like you should know....lol. If you've already got one, I'd love to see a pic or two, and understand how you use it!
Last edited by RicG on Wed May 28, 2014 9:38 pm, edited 1 time in total.
(Disclaimer - This post is for educational purposes only. Always consult a licensed investment professional before taking any trade. Any trade you take is at your own risk.)
- newscalper
- rank: 1000+ posts

- Posts: 1068
- Joined: Tue Oct 19, 2010 5:58 pm
- Reputation: 7
- Gender:

TheRumpledOne wrote:RicG:
Don't know if you watch my DAILY WICK ZONE videos or not. I assume not, since the methods were developed from statistical analysis.
YouTube: TRO DAILY WICK TRADE 002
" filtering for trending vs range-bound price action with optimized TP/SL (R/R) in order to start trading it. "
Sounds like a YALE STUDENT to me...LOL!
TRO - I've just watched the video. One thing that's bothering me/a question I have is: when you talk about price leaving the zones and wick to body distribution - was the analysis run how you are describing and trading it? i.e. the zones being taken from previous daily bar data points and price moving out of the zone on the current daily bar?
So the statistical analysis and the stat that says a body is likely to be larger than a wick applies to the body of the current bar being larger than the PREVIOUS wick, not the current wick when the bar closes?
This leads to a further problem/question in that the current body will be from the current open: imagine the previous bar has a fair sized upper wick. Price today enters the upper zone and then breaks out of the high by 1 pip and then retraces again, closing half way down the zone. This gives a large bodied candle with a large body to wick ratio on THIS bar but the trade was entered w.r.t the previous bar high - i.e. price had to move a country mile before a trade order was triggered.......I know it all boils down to trade management after the entry anyway but the stats and how derived interest me.
I hope the question makes sense?
- TheRumpledOne
- rank: 10000+ posts

- Posts: 15734
- Joined: Sun May 14, 2006 9:31 pm
- Reputation: 3046
- Location: Oregon
- Real name: Avery T. Horton, Jr.
- Gender:

- Contact:
Yes, newscalper, if you look at video 002, it shows the analysis of price entering and leaving the wick zone.
Yes, not the current wick, the previous day's wick is used.
True, if a previous day's wick is large, then price will have to travel a long way to exit. But most likely, price may also pass some other entry triggers along the way. That's why I always say, TRADE WHAT YOU SEE. But if only trade DAILY WICK ZONE trades, then you always have the option to NOT take a trade if it doesn't make sense to you.
IT'S NOT WHAT YOU TRADE, IT'S HOW YOU TRADE IT!
Please do NOT PM me with trading or coding questions, post them in a thread.
Please do NOT PM me with trading or coding questions, post them in a thread.
- newscalper
- rank: 1000+ posts

- Posts: 1068
- Joined: Tue Oct 19, 2010 5:58 pm
- Reputation: 7
- Gender:

TheRumpledOne wrote:Yes, newscalper, if you look at video 002, it shows the analysis of price entering and leaving the wick zone.
Yes, not the current wick, the previous day's wick is used.
True, if a previous day's wick is large, then price will have to travel a long way to exit. But most likely, price may also pass some other entry triggers along the way. That's why I always say, TRADE WHAT YOU SEE. But if only trade DAILY WICK ZONE trades, then you always have the option to NOT take a trade if it doesn't make sense to you.
Sweet
Please add www.kreslik.com to your ad blocker white list.
Thank you for your support.
Thank you for your support.
- TheRumpledOne
- rank: 10000+ posts

- Posts: 15734
- Joined: Sun May 14, 2006 9:31 pm
- Reputation: 3046
- Location: Oregon
- Real name: Avery T. Horton, Jr.
- Gender:

- Contact:
- TheRumpledOne
- rank: 10000+ posts

- Posts: 15734
- Joined: Sun May 14, 2006 9:31 pm
- Reputation: 3046
- Location: Oregon
- Real name: Avery T. Horton, Jr.
- Gender:

- Contact:
- TheRumpledOne
- rank: 10000+ posts

- Posts: 15734
- Joined: Sun May 14, 2006 9:31 pm
- Reputation: 3046
- Location: Oregon
- Real name: Avery T. Horton, Jr.
- Gender:

- Contact:
-
LegendofZline
- rank: 150+ posts

- Posts: 200
- Joined: Tue Jan 15, 2013 2:43 am
- Reputation: 61
- Gender:

TRO,
how about if the daily wick sizes are small.
and it whipsaws around both entry points.
Will you skip entries based on small wicks. that are less then 5pips?
another thing.....
what is your perspective on the beginning of the day. Will you enter buy or sell right in the beginning of the day based on the price hitting entry points?
correction: I think you just answer my question on you post above.
So you would wait until price closes in the zone. Then enter when price decides to leave those areas...
Please add www.kreslik.com to your ad blocker white list.
Thank you for your support.
Thank you for your support.


